Documentation Index
Fetch the complete documentation index at: https://docs.amplication.com/llms.txt
Use this file to discover all available pages before exploring further.
Enterprise-grade Visibility
When your developers spin up new resources or iterate on existing ones, the Architecture Graph gives you real-time visibility to maintain control, compliance, and consistency across your software ecosystem. The Architecture Graph gives you:Complete Visibility
Get a comprehensive view of all services, APIs, and resources across your organization’s projects in one unified interface.
Standardization Control
Easily identify deviations from standards and track service relationships to maintain architectural consistency.
Dependency Management
Visualize and manage service dependencies to reduce risks and improve system reliability.
Resource Optimization
Identify redundancies and optimize resource allocation across your service ecosystem.
Powerful Grouping
You can group your graph based on various criteria to understand your architecture from different perspectives. These grouping options can be combined in powerful ways, allowing you to create unique, multi-dimensional views of your architecture that suit your specific needs.Project
Project
View all services and resources grouped by their respective Amplication project. This helps in understanding the scope and ownership of different parts of your application.
Blueprint
Blueprint
Group resources by the blueprints they are instantiated from. This allows you to see all instances of a particular blueprint and ensures consistency in their configurations.
Git Organization
Git Organization
Organize your services based on the Git organization they are associated with. This is particularly useful for managing services across multiple organizations.
Git Repository
Git Repository
Group services by their specific Git repository. This provides a clear view of where the code for each service resides.
Live Templates
Live Templates
See which services are instantiated from specific live templates. This helps ensure adherence to your organization’s standardized service patterns.
Catalog Properties
Catalog Properties
Use your custom catalog properties to group services based on specific attributes like domain, team, technology, or anything else you create. This allows for highly customized views tailored to your organization’s structure.
Type
Type
Group resources by their type (e.g., Service, API, Message Broker). This gives you a high-level overview of the different kinds of components in your ecosystem.
Detailed Filtering
By default, the Architecture Graph displays all services and resources across your workspace. You can then apply filters to focus on specific aspects of your architecture:- Type: Filter by resource types such as blueprints, message brokers, services, or templates
- Project: Focus on resources within specific projects
- Owner/Team: View resources by their assigned owners or teams
- Catalog Properties: Filter based on custom catalog properties
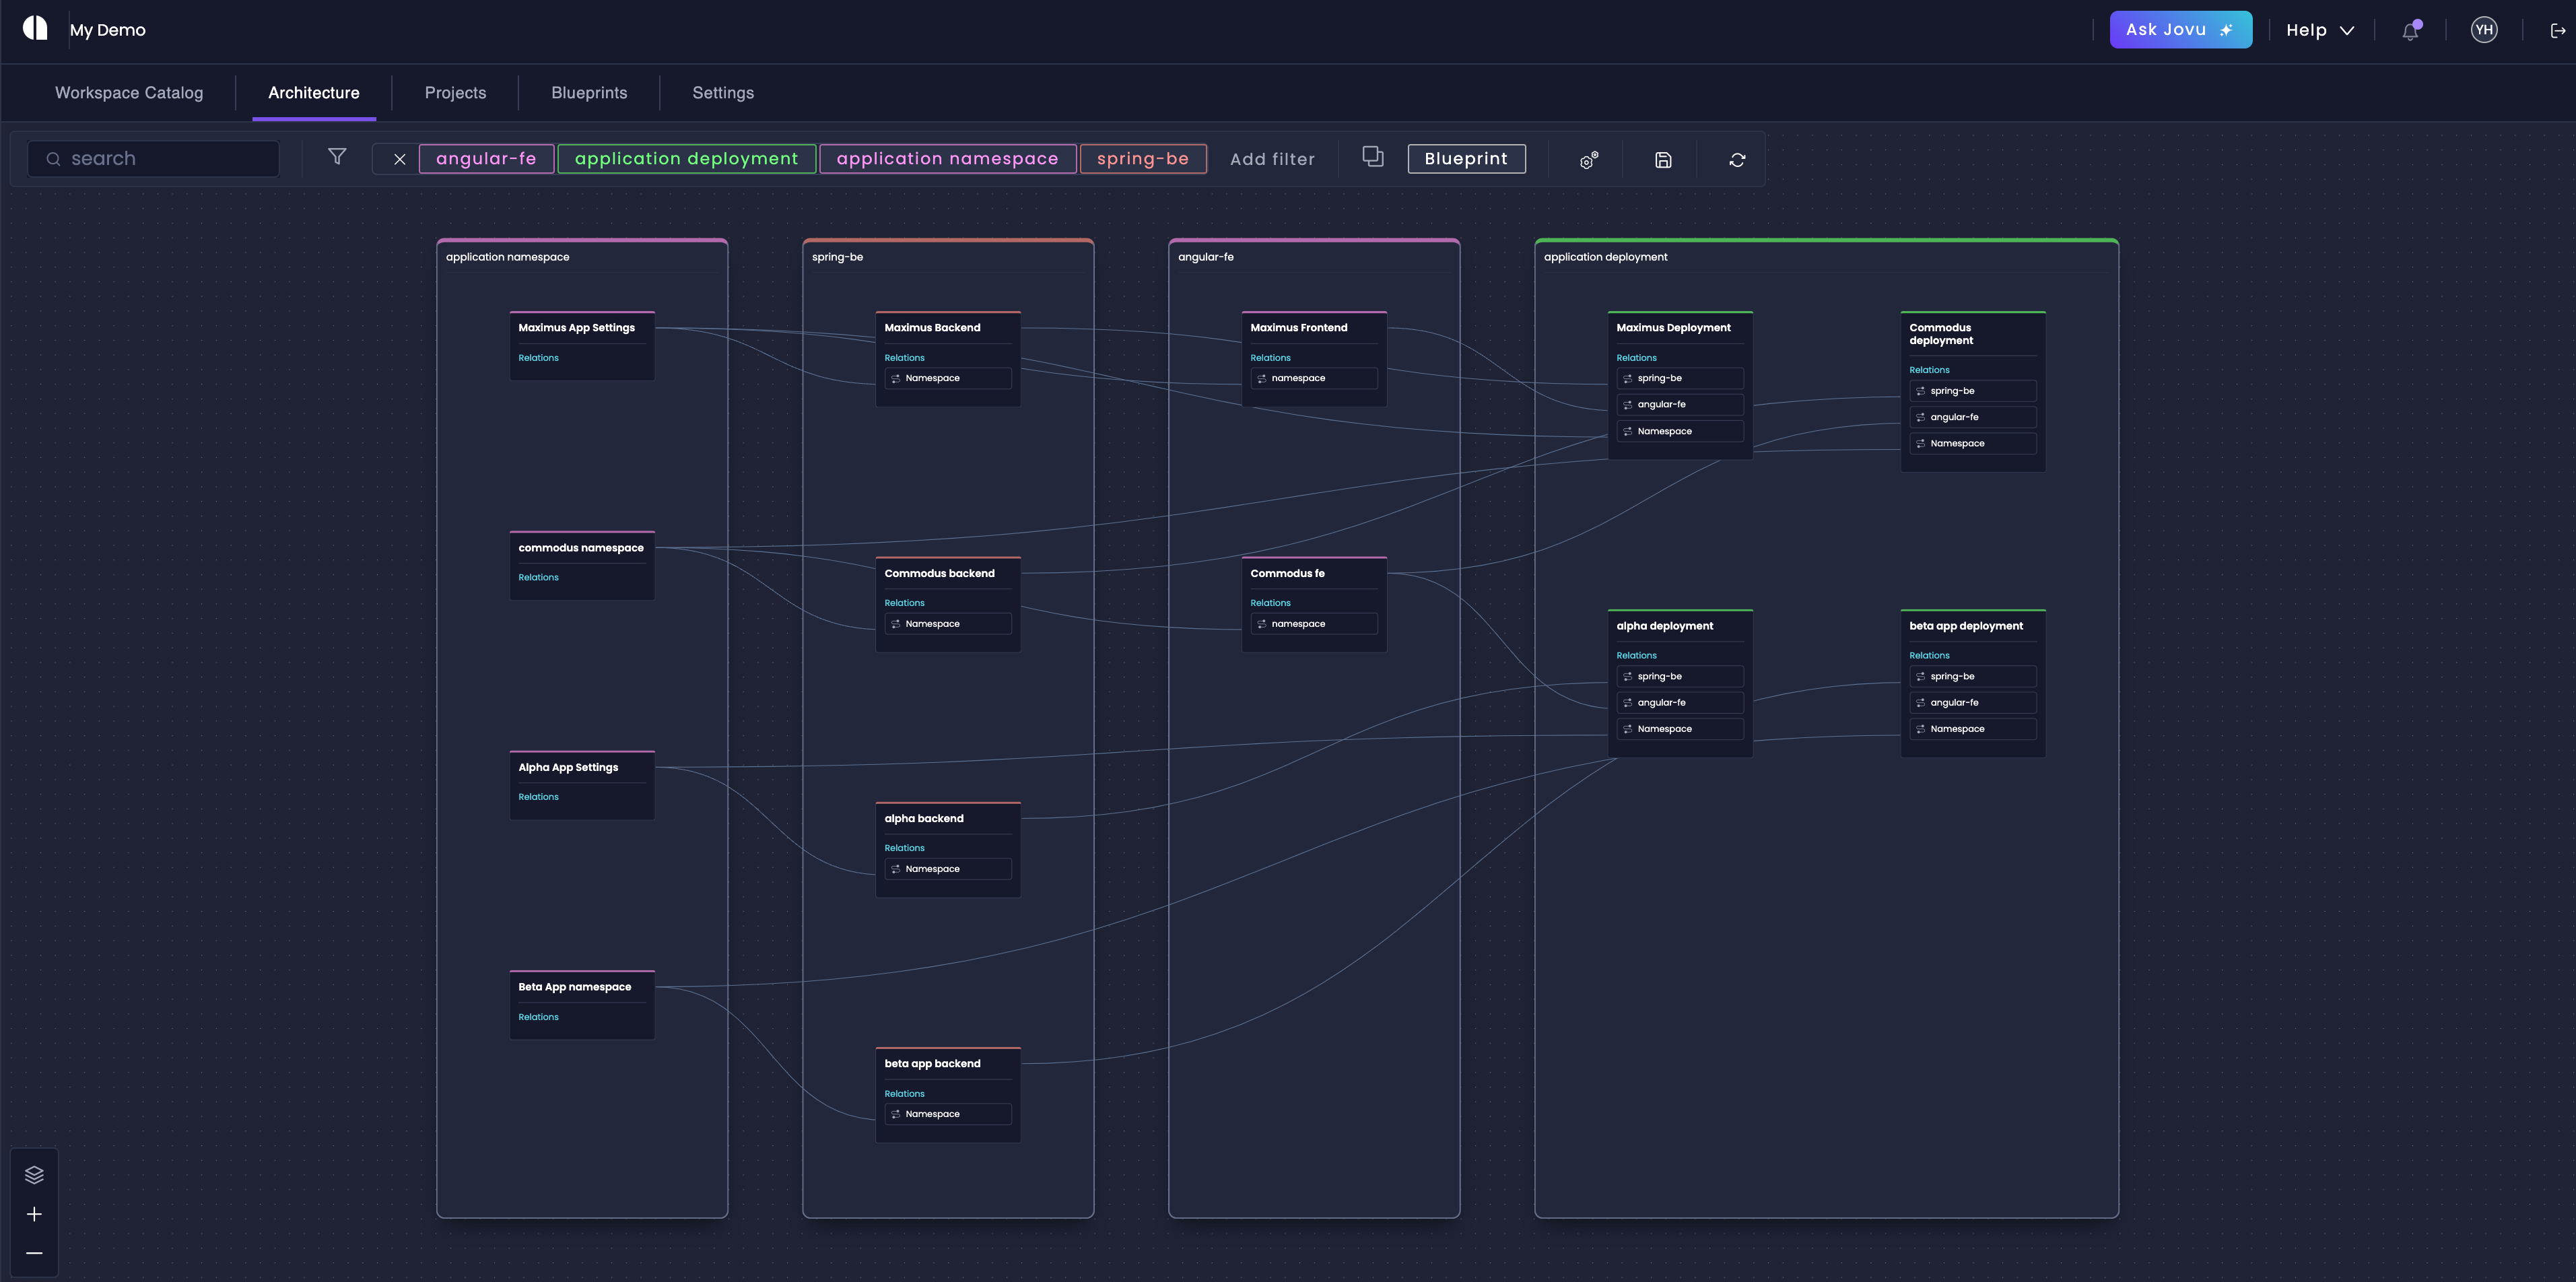
Dependency Visualization
Get a complete picture of how your entire ecosystem fits together with the Architecture Graph’s dependency visualization capabilities. Every connection between Blueprints is mapped out in an intuitive visual format, giving you unprecedented insight into your architecture’s interconnections. This visualization builds upon the graph found in the Blueprint Relations Graph, but extends beyond a single blueprint to show all of your connections and how they’re related to other resources.Access the Architecture Graph
Amplication’s Architecture Graph is in a dedicated workspace-level tab. To access it:
This centralized view ensures your team has a single place to visualize all of your resources, simplifying governance and updates.
Next Steps
Now that you understand the Architecture Graph, you can:Explore Blueprints
Learn how to create and manage blueprints to standardize your service architecture and see their relationships in the graph.
Configure Catalog Properties
Set up catalog properties to enhance your graph organization and create custom views based on your team’s needs.